
VisActor
Open-source data visualization suite from ByteDance with chart, table, graph and AI-assisted storytelling libraries.
VisActor is an open-source visualization toolkit published by ByteDance. VisActor bundles separate libraries for charts, tables, graph diagrams, rendering and data storytelling, plus VMind for automated, intelligent chart creation. Developers use VisActor by picking the module they need from the project's GitHub repositories and embedding it in dashboards, BI tools or office applications.
Best for Developers and BI teams who need chart, table and graph components that also support animated, story-driven presentation of data.
- Made by
- ByteDance
- Added
Last verified: . Information taken from visactor.io.
What is VisActor?
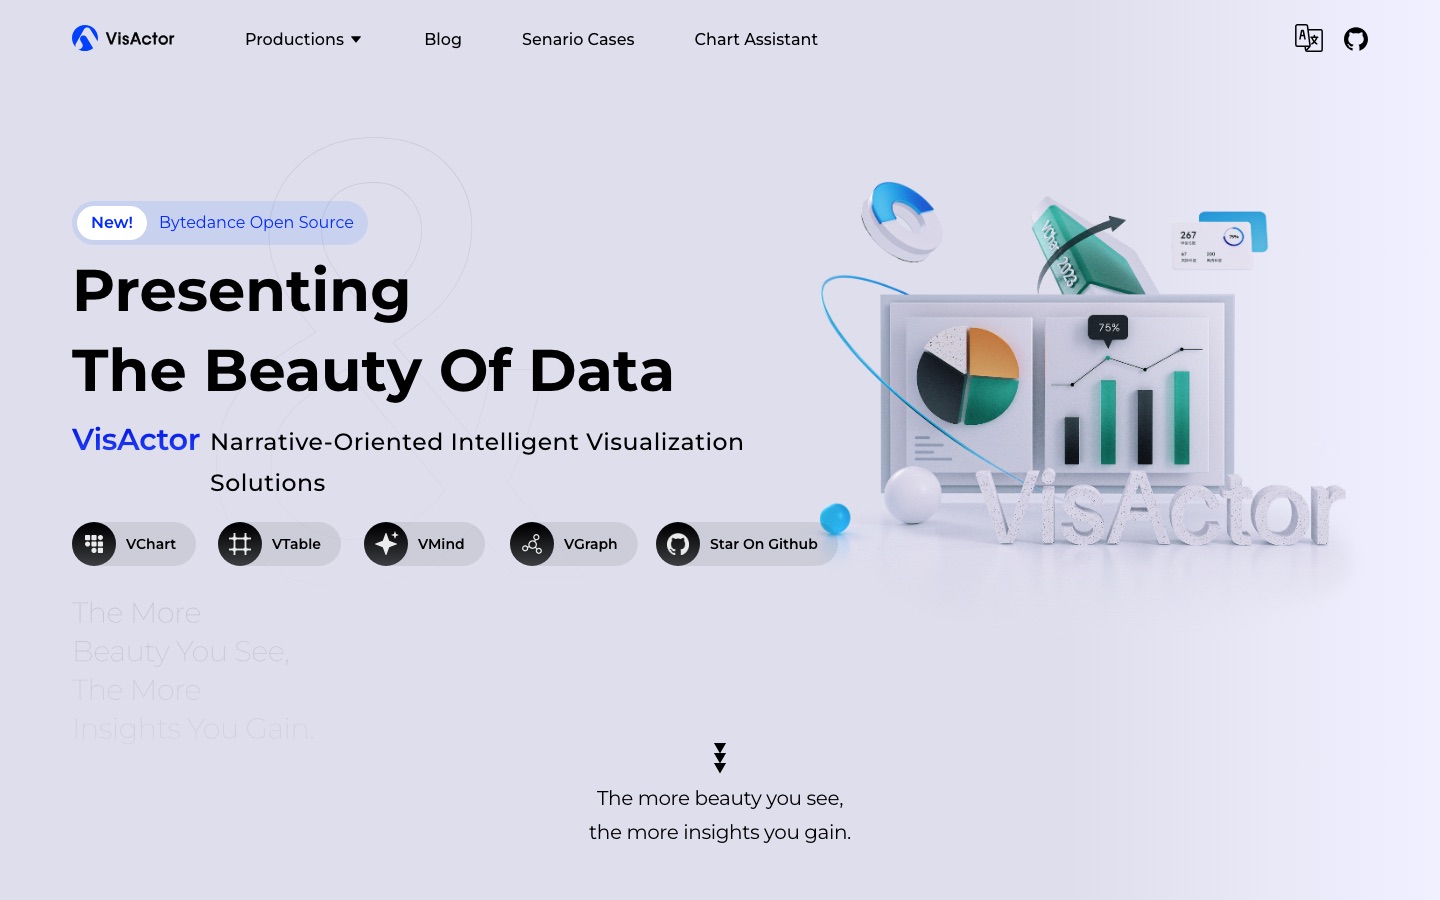
VisActor is a collection of open-source visualization libraries that originated in ByteDance's own products. The project covers ordinary charting needs while putting particular weight on narrative visualization, with intelligent visualization named as its longer-term direction. It is organised as modules: VChart is the chart library, VTable handles multi-dimensional analysis tables, VGrammar is a visualization grammar, VRender is the underlying rendering engine, and VGraph draws relationship graphs. VMind adds automated, intelligent chart generation, VStory is a framework for building data stories, and VSeed composes data for display. The site lists large-screen displays, business intelligence and office suites as typical settings, and names Lark, TikTok, CapCut and Volcano Engine among products that use it. A Chart Assistant and scenario examples are linked from the home page.
Key Features
VChart
A chart library that runs across different device environments and supports animation for telling a story with data.
VTable
A table component aimed at fast, multi-dimensional data analysis with custom cell rendering.
VMind
The intelligent module of the suite, which automates chart creation.
VStory
A framework for assembling charts and other elements into a narrated data story.
VGraph
A graph visualization library for exploring how entities in a dataset relate to one another.
VRender and VGrammar
A rendering engine and a visual grammar that the higher-level libraries are built on and that can be used directly.
Use Cases
- Large-screen dashboards
- Build wall displays that combine many chart types with animation and live data updates.
- BI products
- Embed configurable charts with built-in analysis functions in a business intelligence tool.
- Office applications
- Add charts and tables to documents or chat tools that must render on many kinds of device.
- Data storytelling
- Create animated sequences that walk an audience through a set of findings.
- Relationship analysis
- Draw network diagrams to inspect links between people, accounts or systems.
Things to know
- A developer toolkit, not an app
- VisActor is delivered as code libraries that have to be integrated into your own software.
- Modules are separate projects
- Each library, from VChart to VGraph, has its own purpose and can be adopted independently.
- Community channels
- The project points users to GitHub, Discord and email for contact.
FAQs
What is VisActor?
VisActor is an open-source data visualization suite from ByteDance made up of chart, table, graph, rendering and storytelling libraries.
What is VisActor used for?
VisActor is used to build charts, analysis tables, large-screen dashboards and data stories inside web and office applications.
Who makes VisActor?
VisActor is published by ByteDance as an open-source project and grew out of visualization work across the company's products.
Is VisActor open source?
Yes. VisActor is presented as a ByteDance open-source project, and its code is hosted on GitHub.
Does VisActor include AI features?
Yes. VisActor includes VMind, a module for automated, intelligent chart generation, and the site links to a Chart Assistant.
Which libraries are part of VisActor?
VisActor consists of VChart, VTable, VGrammar, VRender, VMind, VStory, VSeed and VGraph.
Who it's for
- Front-end developers
- BI teams
- Data analysts
- Dashboard builders
- Product engineers
Comments
No comments yet. If you have used VisActor, tell other readers how it went.
Alternatives to VisActor
| Tool | Free plan | Starting price | API |
|---|---|---|---|
 AI Graph MakerWeb tool that turns typed descriptions or uploaded data into charts, flowcharts, mind maps and diagrams. |
Yes | — | — |
 AirbyteOpen-source data movement platform that replicates data from 700+ sources and exposes it to analytics and AI agents. |
— | — | Yes |
 ChartGen AIAI chart generator that turns uploaded CSV or Excel data and a plain-language request into finished charts. |
Yes | — | — |
 CrawlbaseWeb crawling and scraping infrastructure with a crawling API, rotating proxy, managed scrapers and an MCP server. |
Yes | — | Yes |
 Elastic StackSuite built around Elasticsearch for search, observability and security, with vector search and AI agent tooling. |
— | — | Yes |
Listed in the same categories as VisActor. A starting price appears only where we checked it on the maker’s pricing page; a dash means not checked or not published. All Data Analysis & Analytics tools