Image prompt Branding & UI Customizable
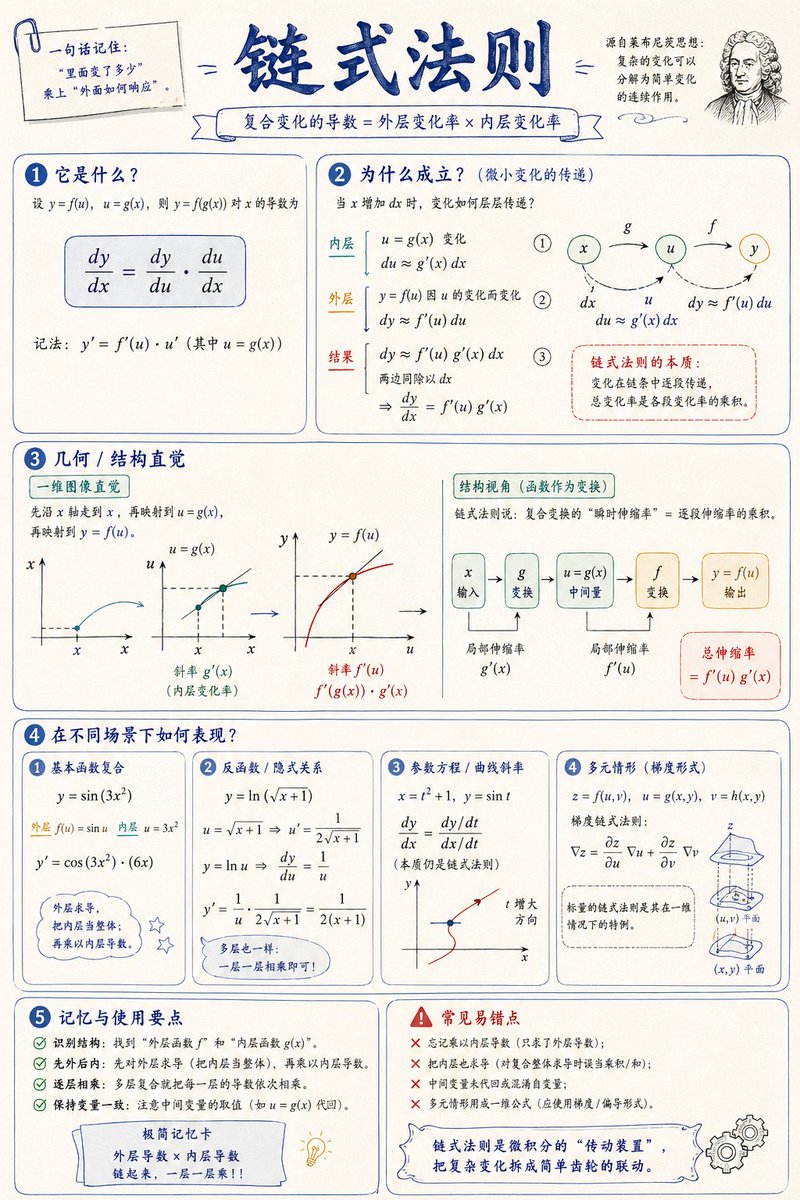
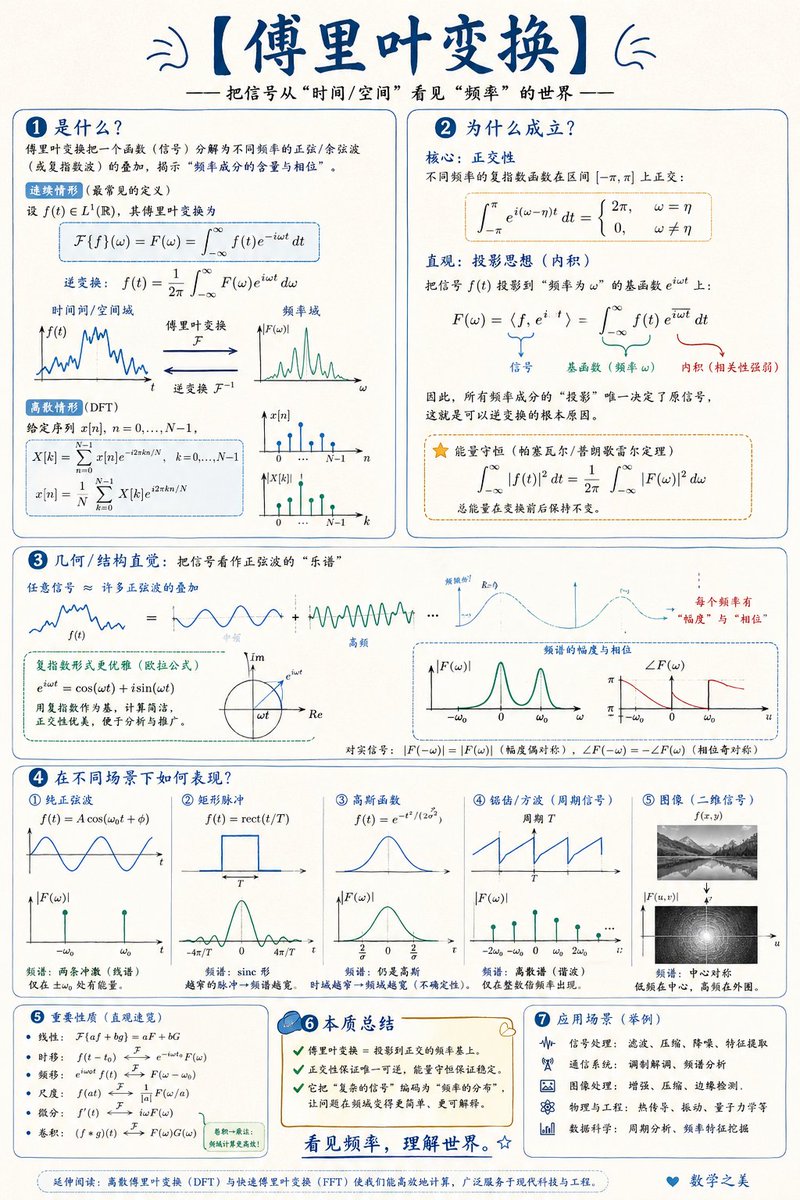
Math Concept Visual Explainer Poster
A hand-drawn lecture-style poster that walks through one math idea in layers: what it is, why it holds, its geometric shape, and how it behaves across cases. Numbered cards, zoom-in boxes and a summary bar keep the page calm and easy to scan.

- Model
- GPT Image 2
- Type
- 2 images
- Aspect ratio
- 2:3
- Shared
- 26 Apr 2026
- Likes on X
- 1,021
Image prompt
827 charactersCreate a math visualization infographic about "[math concept/topic]", with the goal of helping the reader intuitively understand: what it is, why it holds, what the geometric/structural intuition is, and how it behaves across different scenarios. The image should look like a high-quality math lecture handout + a hand-drawn educational poster: elegant, clear, rich in information, but not cluttered. Visual style: portrait or landscape, clean light paper background, dark-blue title, black/dark-gray body lines, with a few elegant blue, teal, gold, and red accent colors. Use rounded-corner cards, thin-line borders, numbered labels, hand-drawn arrows, local zoom-in boxes, and a summary bar. The overall look should be beautiful, balanced, and academic, making the "structure" and the "why" of the concept clear at a glance.
How to use it
It was shared as a GPT Image 2 prompt. Replace the bracketed placeholder with any topic you want explained, such as the Pythagorean theorem or a limit, and keep the instructions about layout and purpose so the poster still reads as a structured handout. The palette of dark-blue title, dark-gray lines and small blue, teal, gold and red accents is what gives the result its academic calm, so keep that intact. The finished poster works well as a classroom handout or a study card.
Featured inInfographic AI promptsEducational and science explainer prompts
Shared publicly on X on 26 Apr 2026. All credit for this prompt and its result goes to its creator. Is this yours? Ask for an update or removal.