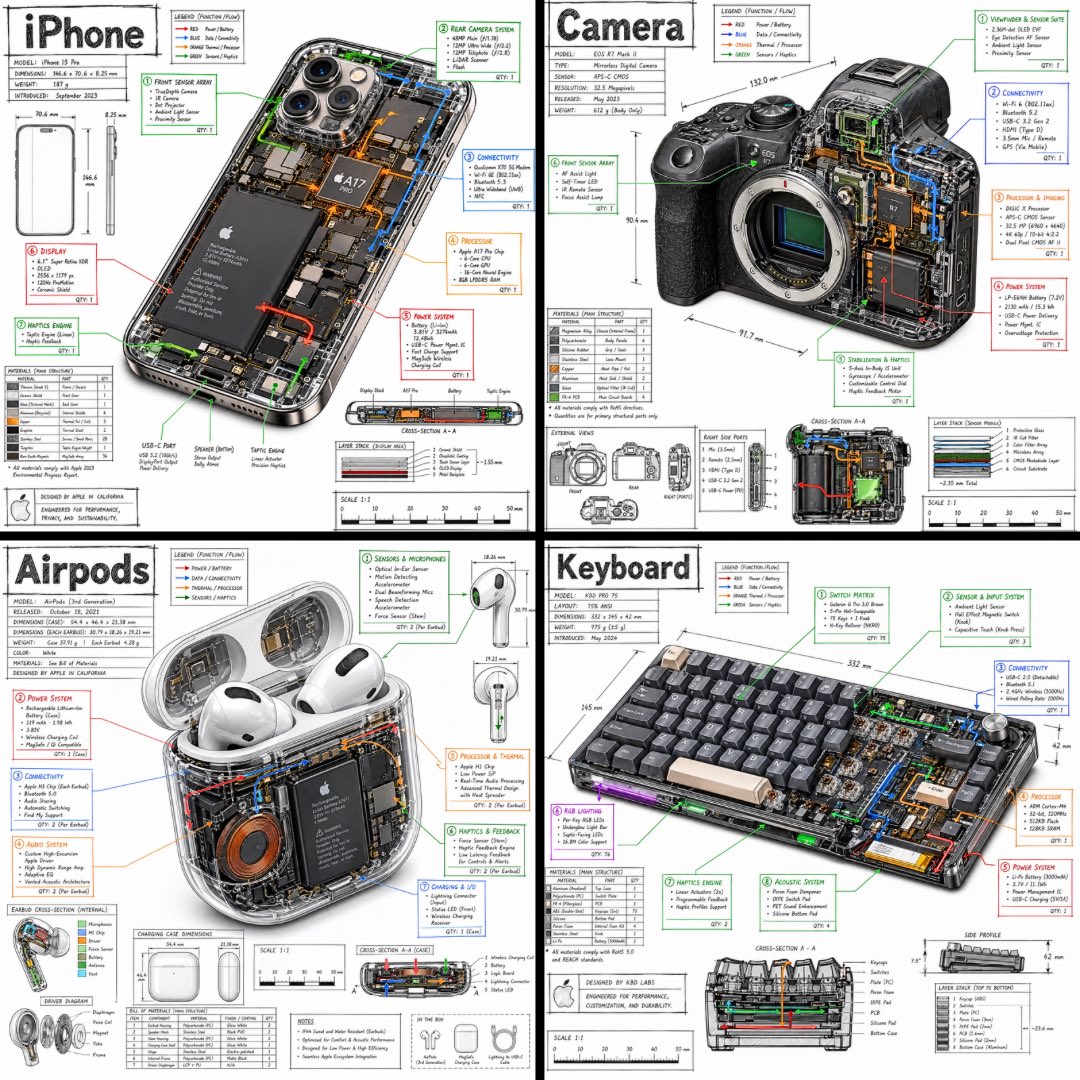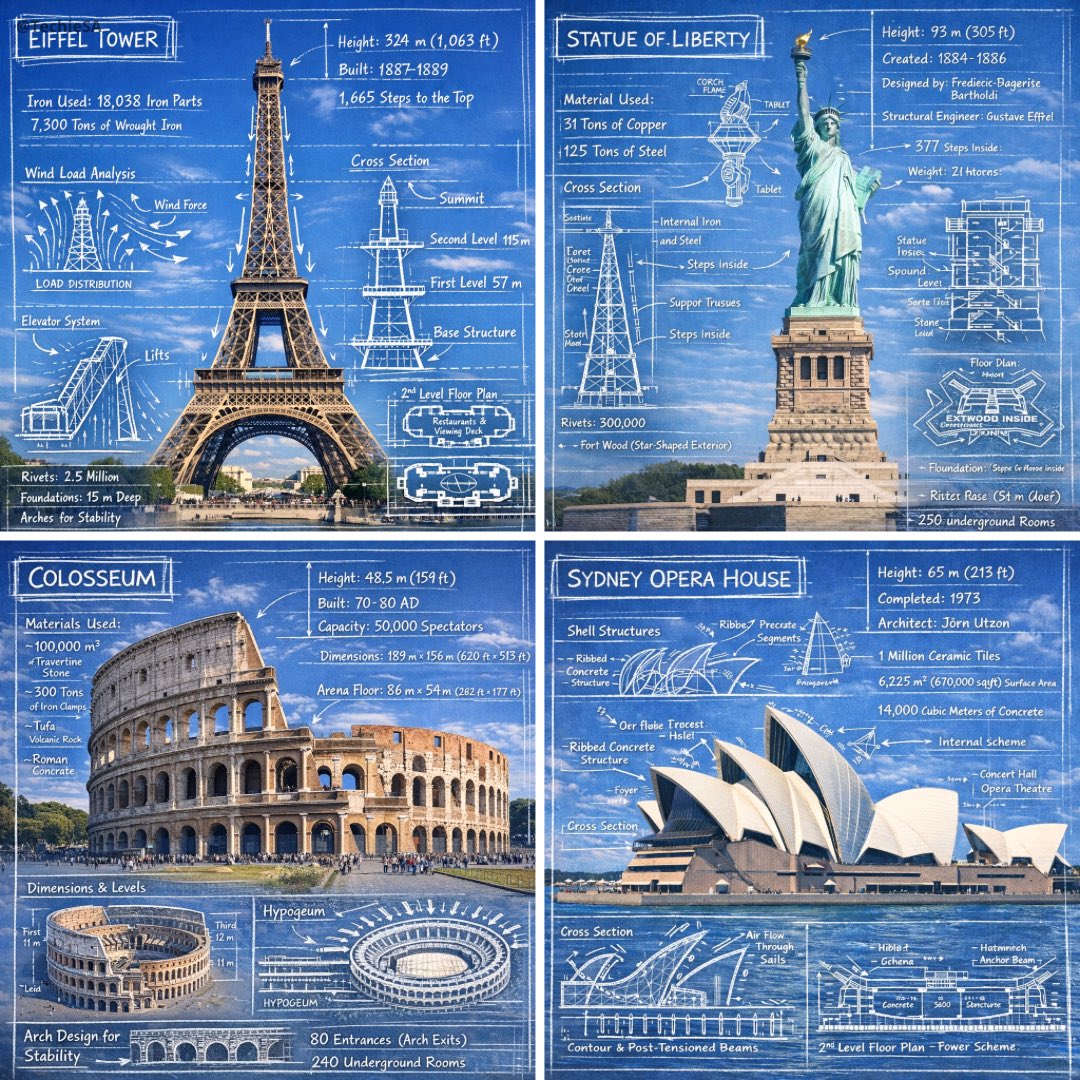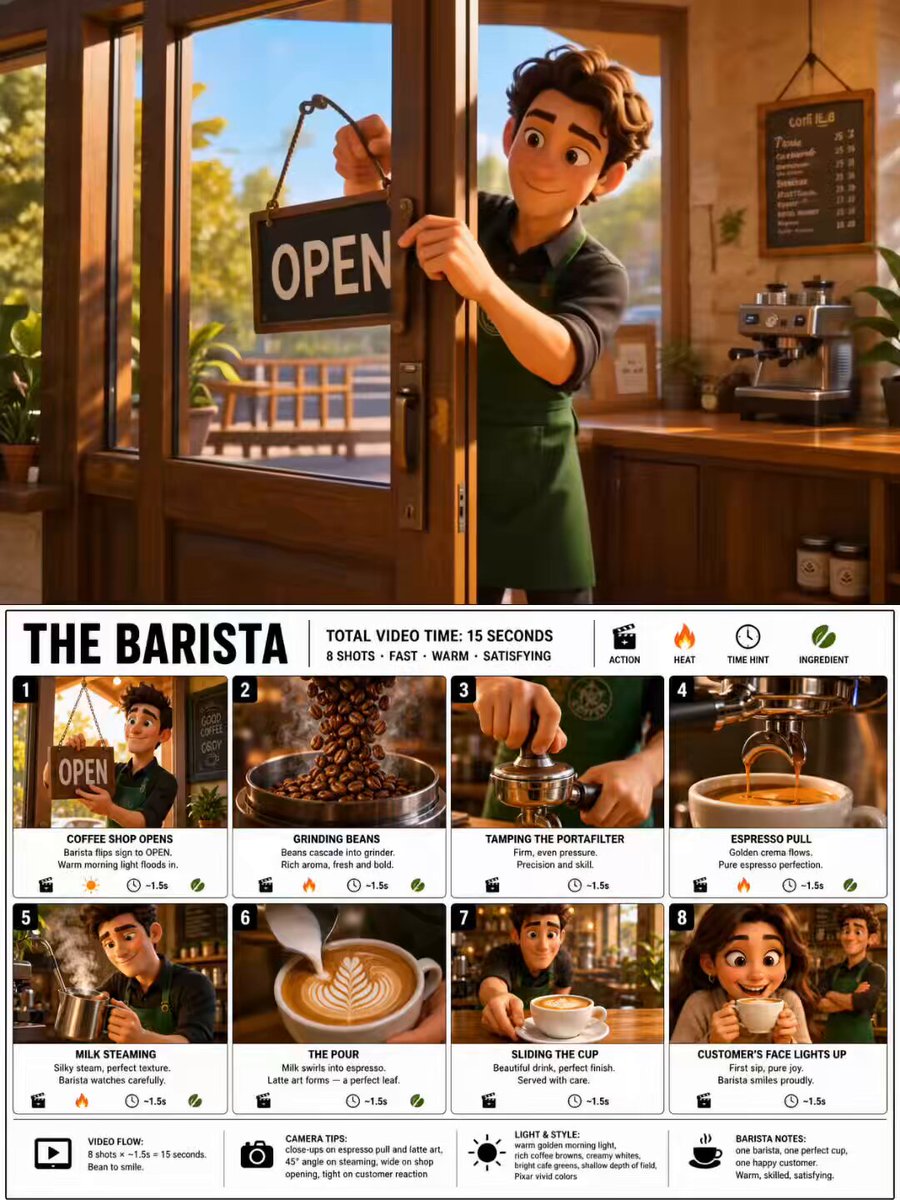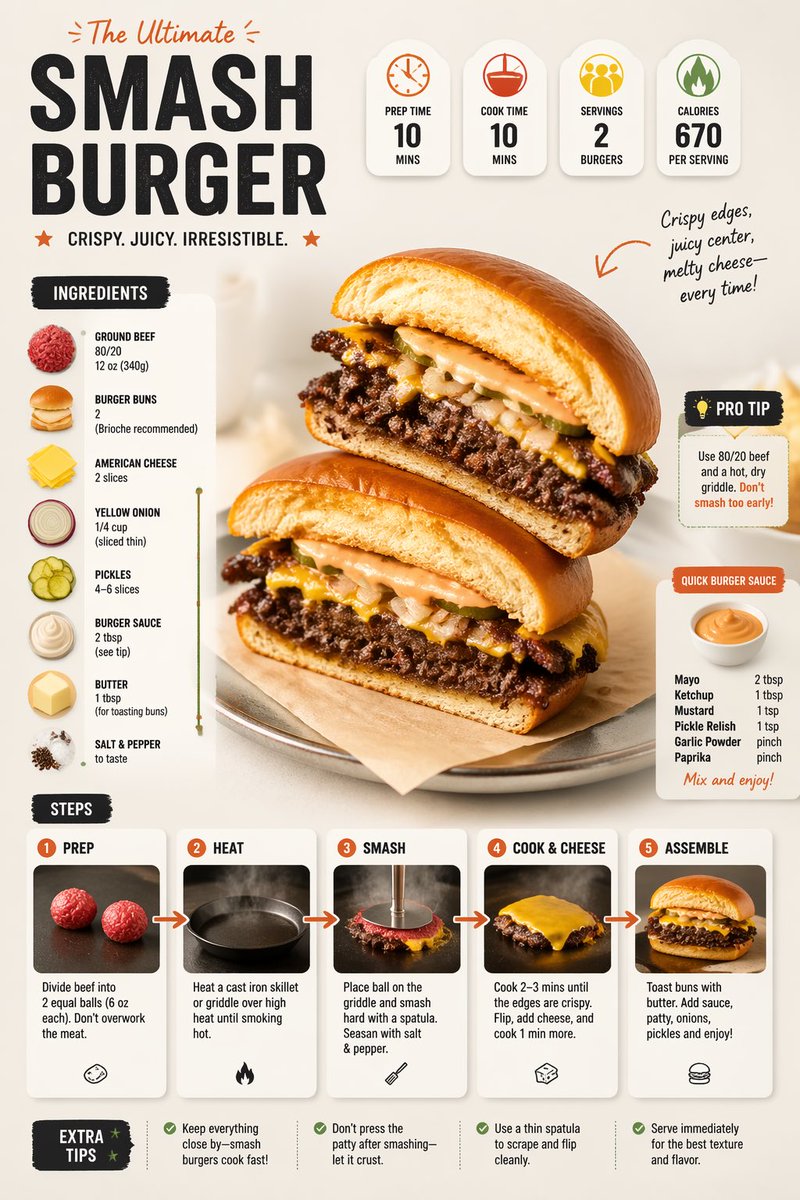
Промпт для изображения Еда и напитки Настраиваемые
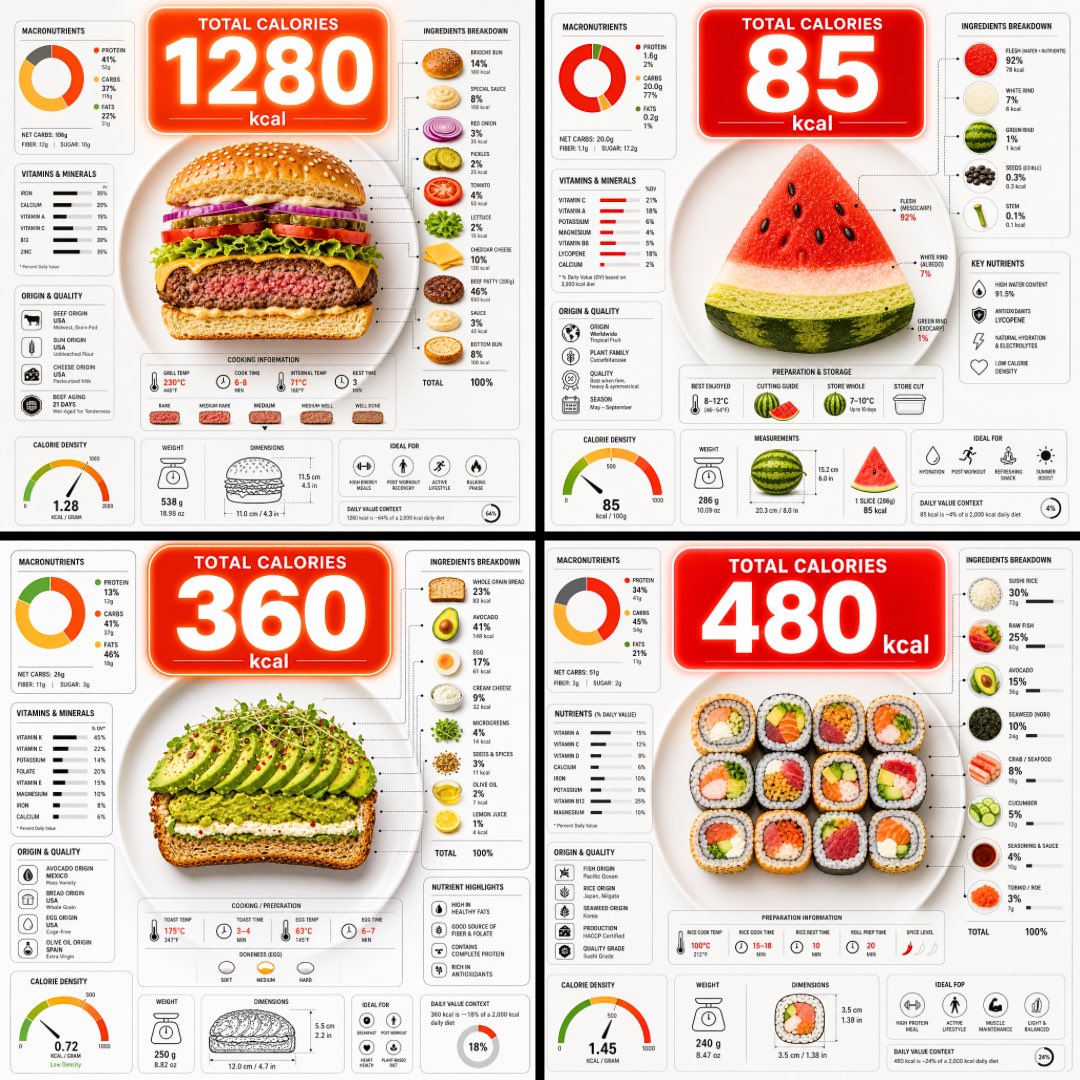
Инфографика калорийности блюда, вид сверху
Вид сверху на тарелку, разрезанную так, чтобы были видны слои, над ней плывёт большой пузырь с калориями, а вокруг расположены плотные диаграммы питательной ценности. Блюдо читается с первого взгляда, а цифры позволяют быстро сравнить то, что лежит на тарелке.

- Модель
- GPT Image 2
- Тип
- Изображение
- Соотношение сторон
- 1:1
- Опубликован
- 9 июн. 2026
- Лайки на X
- 91
Промпт для изображения
Символов: 2,034Ultra-clean top-down (90° flat lay) infographic composition. A perfectly centered white ceramic plate sits on a seamless light background. On the plate: [FOOD], shown in a precise cross-section or layered cutaway, revealing internal ingredients, textures, and structure with extreme clarity. PRIMARY FOCAL POINT (HERO ELEMENT): Above the plate, occupying a large portion of the upper canvas, place an oversized floating infographic bubble displaying the scientifically accurate total calorie count for this exact food item and portion size. The calorie bubble is significantly larger than any other element, instantly readable at thumbnail size. Design it with strong visual contrast: bold sans-serif typography, thick outline or semi-transparent glassmorphism, subtle glow or drop shadow, and clean UI styling. This is the first thing the eye sees. SECONDARY ELEMENTS: Surrounding the plate, fill the remaining space with a dense, high-information infographic system using realistic, accurate nutritional data for this specific food: – Nutritional breakdown charts (protein, carbs, fats in exact grams) – Ingredient percentage bars and rings – Cooking or preparation temperatures and times – Origin, aging, or production icons – Measurement scales, micro-diagrams, data badges. All numbers must reflect real-world nutritional values for the depicted food. Use thin vector connectors, dotted lines, arrows, pictograms, and radial charts clearly linking data to specific food components. Visual hierarchy rules: Calorie bubble = dominant. Plate + food = secondary anchor. Surrounding data = tertiary but dense and readable. Design language: premium editorial infographic, Apple UI × National Geographic food science, extremely clean, structured, and modern. Color palette: natural food colors, monochrome infographic UI, one accent color reserved exclusively for the calorie bubble. Lighting: soft studio lighting, zero clutter, flat background for maximum contrast. Output: 1080×1080, ultra-crisp, social-feed optimized, no watermark.
Как использовать
Замените заполнитель [FOOD] в квадратных скобках на блюдо, которое хотите показать, и укажите размер порции, чтобы пузырь с калориями соответствовал ей. Сохраните ракурс сверху под 90 градусов, белую тарелку на светлом фоне и единственный акцентный цвет, отведённый только под пузырь с калориями: эти решения делают композицию понятной. Промпт был опубликован для GPT Image 2, а результат хорошо подходит для квадратного поста к рецепту или объяснению о питании.
Опубликовано в открытом доступе на X: 9 июн. 2026. Все права на этот промпт и его результат принадлежат автору. Это ваш промпт? Попросите обновить или удалить его.