Prompt d'image Branding et UI Personnalisables
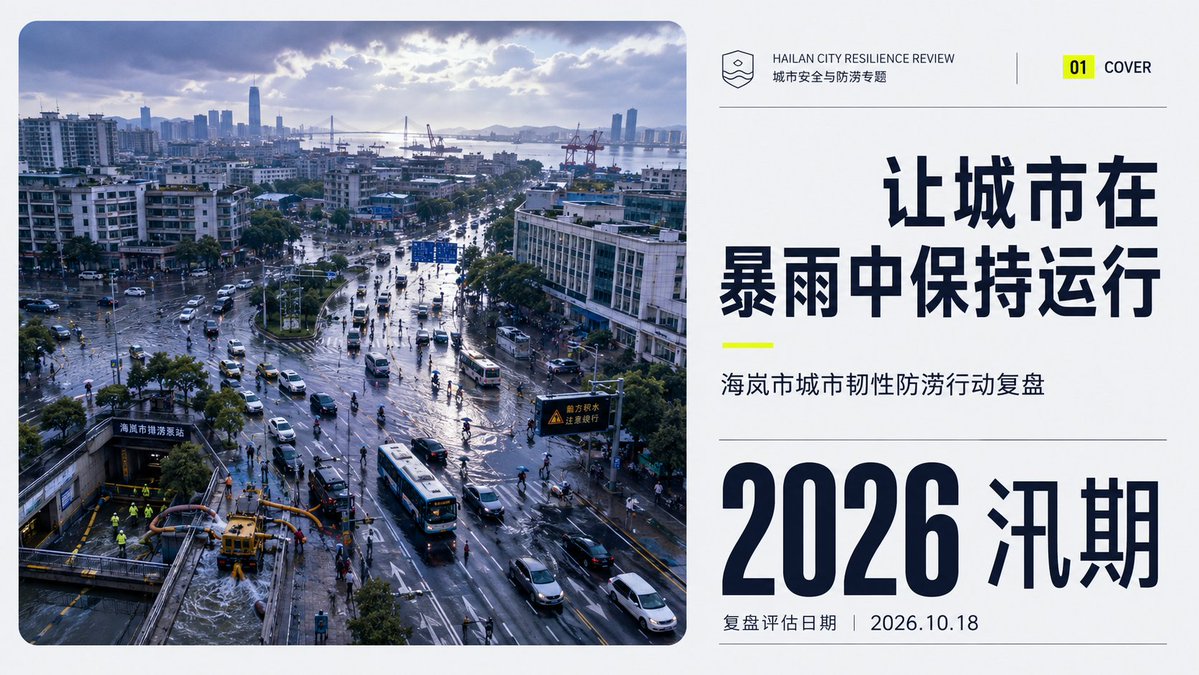
Dossier de bilan de résilience urbaine aux inondations après un orage
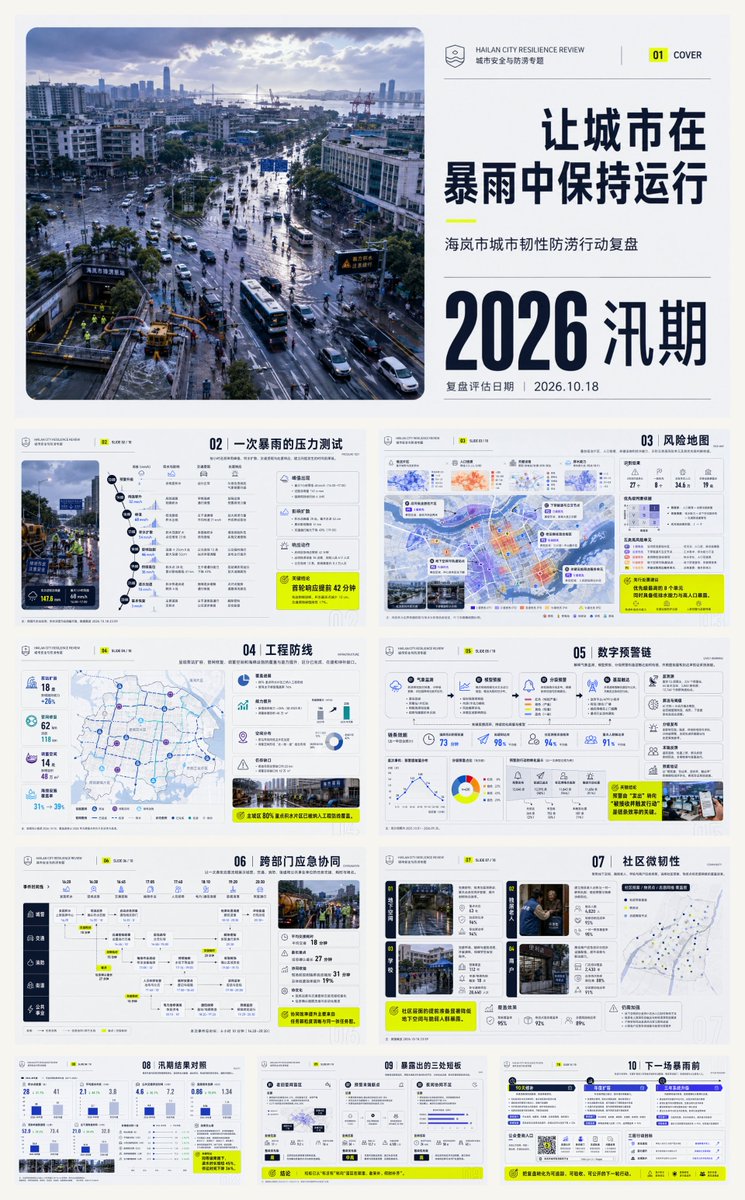
Une présentation de rapport en 10 diapositives qui examine comment une ville a continué de fonctionner pendant un orage, du pic horaire de pluie au plan de réparation sur 90 jours. Des photos aériennes façon documentaire et des mises en page en grille épurées rendent le bilan de la saison des crues facile à parcourir.

- Modèle
- GPT Image 2
- Type
- 4 images
- Partagé
- 1 août 2026
- J'aime sur X
- 109
Nom de la villePériode d'examen
Prompt d'image
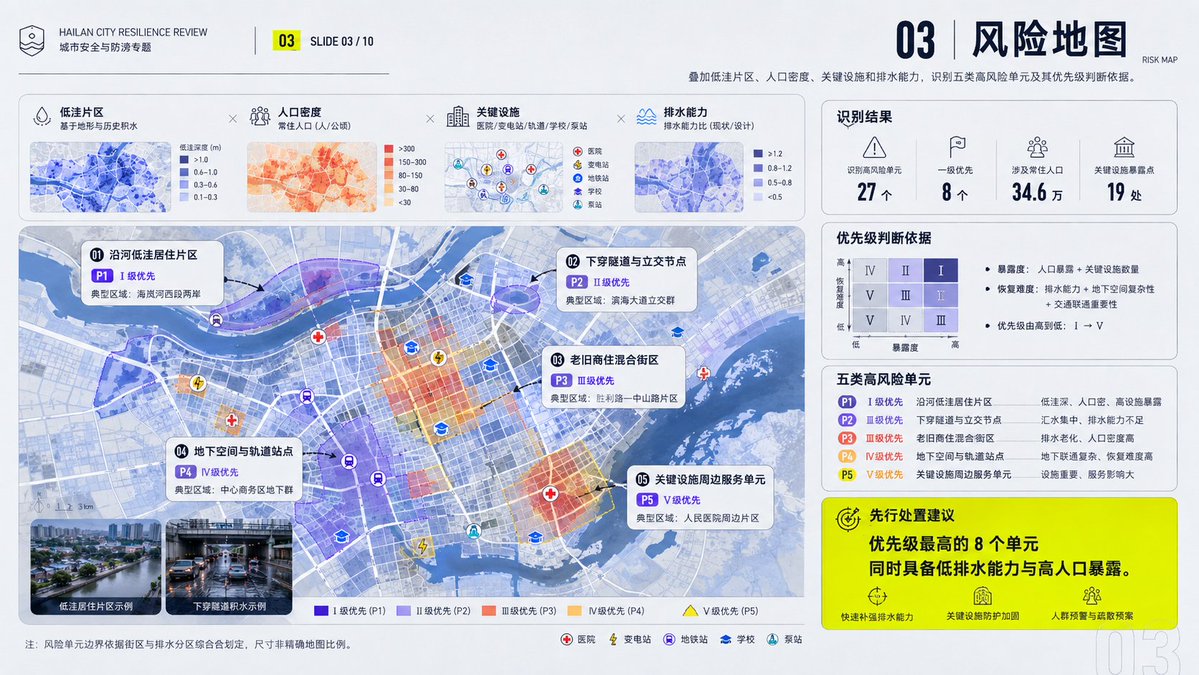
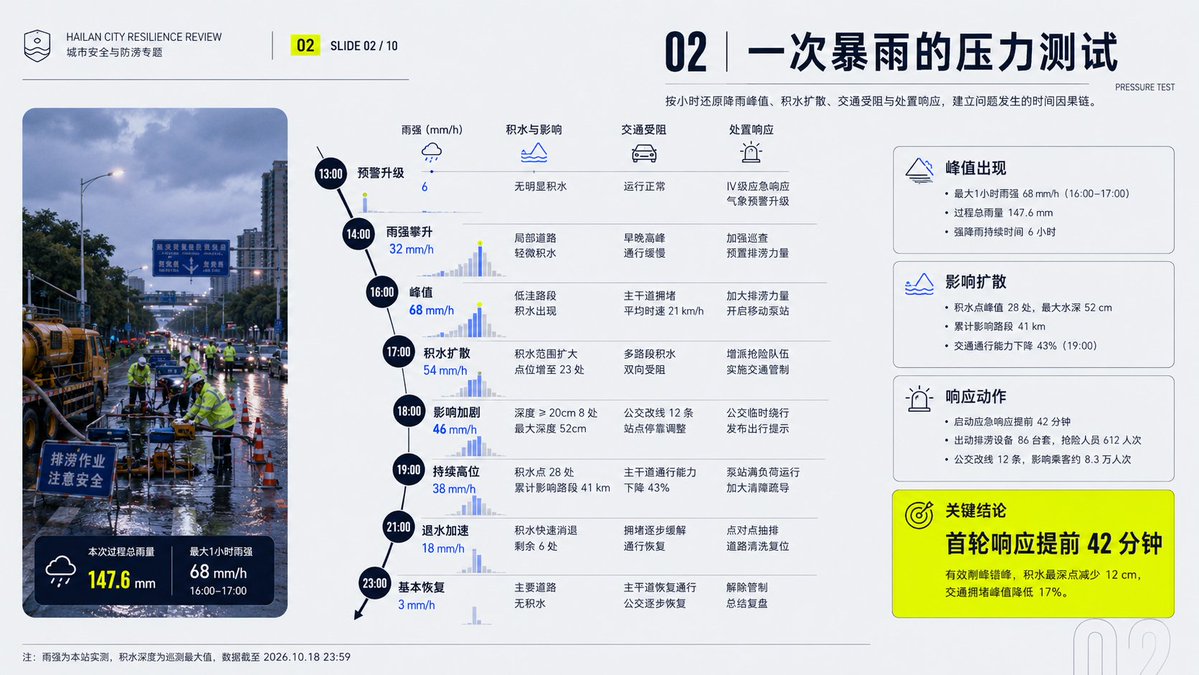
6,214 caractèresBuild a report-style PPT that juxtaposes large-scale documentary photography with a clear information architecture, anchored by the International (Swiss) typographic system: use a modular grid and baseline grid to lock column width, margins, and the rhythm of headings and body text; use the Gestalt law of proximity and common regions to group content into scannable blocks; use editorial rhythm to create tension and release across key-visual pages, airy information pages, and multi-column data pages. Draw on Josef Müller-Brockmann for the asymmetric mathematical grid that governs alignment, Alexey Brodovitch for narrative pauses through radical cropping, image scale, and white space, Massimo Vignelli for consistency via limited typefaces and unified components, and Josef Albers for calibrating the legibility of chapter color tags and information cards through relationships between adjacent color fields—each method in its own domain, without mechanical imitation. Establish replaceable color roles: the key-visual field occupies 55%–70%, mid-dark value, mid-to-high saturation, retaining natural light-and-shadow layers; the paper background occupies 20%–35%, high lightness and low saturation; the structural text occupies 8%–15%, with extreme light-dark contrast to ensure crisp projection; chapter coding and key hints together occupy 3%–8%, using several equal-weight high-purity colors to create warm-cool and saturation jumps between adjacent modules. Future theme or brand colors are mapped item by item to key visual, background, text, coding, and hint, replaced in one pass while preserving area ratios, lightness sequence, chroma difference, adjacency relationships, and contrast strength. Pages run on an asymmetric multi-column grid: the theme page lets the high-angle overhead documentary photograph be the main mass, placed within large rounded boundaries, forming a three-tier read with a small logo, the theme title, and an oversized date; content pages combine multi-column text, equal-height cards, and narrow edge-hugging chapter color tags within wide outer margins, allowing one title or photo to break across columns; the bottom edge of the information card is closed by a single directional folded corner, with the first read being the title or focal image, the second the summary, the third the details. Photography uses real ambient light, subtle grain, and near-to-far lightness compression, first natural tonal correction, then cropping with a rounded-corner mask, preserving edge detail and local highlights; information pages use a textureless matte base, overlaid with low-opacity outline numerals, single-line geometric icons, and thin color bars, composited in the order: background, image or card, structural lines, text, coding. Use a harmonious pair of geometric sans-serifs with the same skeleton: the display type is oversized, bold and narrow, tightly set and able to span columns, turning locally into a hollow outline to overlap letter and image; the body uses regular weight and larger leading, captions smaller but with wider letter spacing. Chinese and English type sizes are aligned by optical blackness rather than nominal size, correcting the optical margins of numerals, full-width punctuation, and rounded boundaries, and the body text avoids busy imagery. The whole reads as trustworthy, lucid, pragmatic, open, organic, and action-oriented. —————— Theme: Review of Hailan City's Urban Resilience Flood-Prevention Actions 10 slides total Ratio 16:9 Content logic: 01|Cover: keeping the city running through the storm—a high-angle overhead documentary image of the urban area after the rain locks in the theme of the 2026 flood-season review and the assessment date. 02|The stress test of one storm: reconstructs hour by hour the rainfall peak, the spread of flooding, traffic blockages, and the response, establishing the temporal causal chain of the problem. 03|Risk map: overlays low-lying zones, population density, key facilities, and drainage capacity, identifying five types of high-risk units and the basis for prioritizing them. 04|Engineering defense line: presents pump-station expansion, pipe-network repair, storage space, and sponge facilities, their coverage and capacity gains, distinguishing completed, under construction, and gaps still to be filled. 05|Digital early-warning chain: explains how meteorological monitoring, model forecasting, tiered warnings, and grassroots reach connect, validating system effectiveness through lead time and arrival rate. 06|Cross-department emergency coordination: uses one real response process to show task handovers, time spent, and bottlenecks among urban management, transport, fire services, neighborhoods, and public utilities. 07|Community micro-resilience: focuses on four scenarios—underground spaces, seniors living alone, schools, and merchants—explaining the coverage of community plans, supply points, and volunteer networks. 08|Flood-season results comparison: compares this year with historical rainfall of the same grade, showing the number of flooding points, drainage time, shutdown time, and changes in losses, avoiding reporting only inputs. 09|Three exposed weaknesses: pinpoints blind spots in old pipe networks, breakpoints at the warning endpoint, and insufficient night-time coordination, giving evidence, impact scope, and remediation priority for each. 10|Before the next storm: forms an action roadmap of 90-day repair, annual expansion, and three-year system upgrade, assigning responsible departments, completion standards, and a public inquiry portal. Layout strategy: use storm blue-violet as the key visual, cool gray-white as the background, and fluorescent yellow as the hint color to create a high-alert contrast, with structural text near-black; on the cover, the rounded-corner aerial on the left runs top to bottom while an oversized date and short title stack on the right; interior pages rotate through diagonal event trajectories, unequal-width double columns, locally column-spanning risk maps, and full-page conclusions, with titles right-aligned and numbering leading—the temporal review compact, the risk explanation airy, the action list denser still.
Comment l'utiliser
Remplacez le nom de la ville et l'année dans le titre et les lignes de thème pour correspondre à votre propre bilan urbain. Conservez l'équilibre bleu orage et gris-blanc ainsi que la couleur jaune d'accent, qui portent le contraste de l'alerte maximale. Il a été partagé comme prompt GPT Image 2 : les consignes de mise en page fonctionnent mieux si vous conservez le nombre de diapositives et le cadre 16:9 dans la demande.
Partagé publiquement sur X le 1 août 2026. Tout le mérite de ce prompt et de son résultat revient à son créateur. Ce prompt est le vôtre ? Demandez une mise à jour ou un retrait.