Estudio de prompts
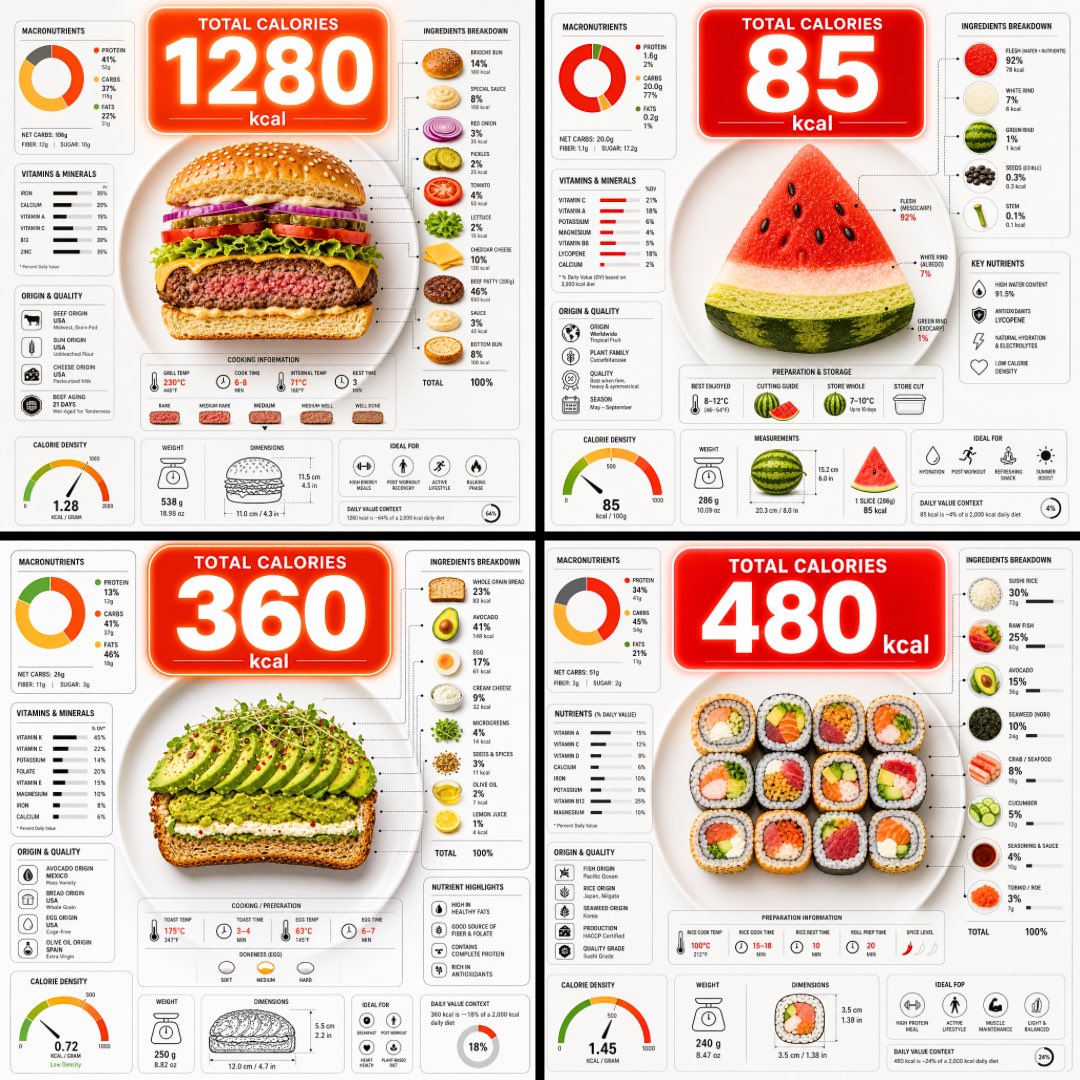
Haz tuyo «Infografía de calorías de un plato, vista cenital»
Una vista cenital de un plato cortado para mostrar sus capas, con una gran burbuja de calorías flotando encima y gráficos nutricionales densos alrededor. La comida se entiende de un vistazo y las cifras sirven como forma rápida de comparar lo que hay en el plato.
 Prompt de @TechieBySA
- Rellena los huecos de abajo.
- Mira cómo se actualiza el prompt a la derecha.
- Cópialo o ábrelo en una herramienta de imágenes.
Prompt de imagen
Ultra-clean top-down (90° flat lay) infographic composition. A perfectly centered white ceramic plate sits on a seamless light background. On the plate: [FOOD], shown in a precise cross-section or layered cutaway, revealing internal ingredients, textures, and structure with extreme clarity. PRIMARY FOCAL POINT (HERO ELEMENT): Above the plate, occupying a large portion of the upper canvas, place an oversized floating infographic bubble displaying the scientifically accurate total calorie count for this exact food item and portion size. The calorie bubble is significantly larger than any other element, instantly readable at thumbnail size. Design it with strong visual contrast: bold sans-serif typography, thick outline or semi-transparent glassmorphism, subtle glow or drop shadow, and clean UI styling. This is the first thing the eye sees. SECONDARY ELEMENTS: Surrounding the plate, fill the remaining space with a dense, high-information infographic system using realistic, accurate nutritional data for this specific food: – Nutritional breakdown charts (protein, carbs, fats in exact grams) – Ingredient percentage bars and rings – Cooking or preparation temperatures and times – Origin, aging, or production icons – Measurement scales, micro-diagrams, data badges. All numbers must reflect real-world nutritional values for the depicted food. Use thin vector connectors, dotted lines, arrows, pictograms, and radial charts clearly linking data to specific food components. Visual hierarchy rules: Calorie bubble = dominant. Plate + food = secondary anchor. Surrounding data = tertiary but dense and readable. Design language: premium editorial infographic, Apple UI × National Geographic food science, extremely clean, structured, and modern. Color palette: natural food colors, monochrome infographic UI, one accent color reserved exclusively for the calorie bubble. Lighting: soft studio lighting, zero clutter, flat background for maximum contrast. Output: 1080×1080, ultra-crisp, social-feed optimized, no watermark.
Prompt compartido en X por @TechieBySA. Todo el mérito es de su creador.
Más prompts que puedes personalizar
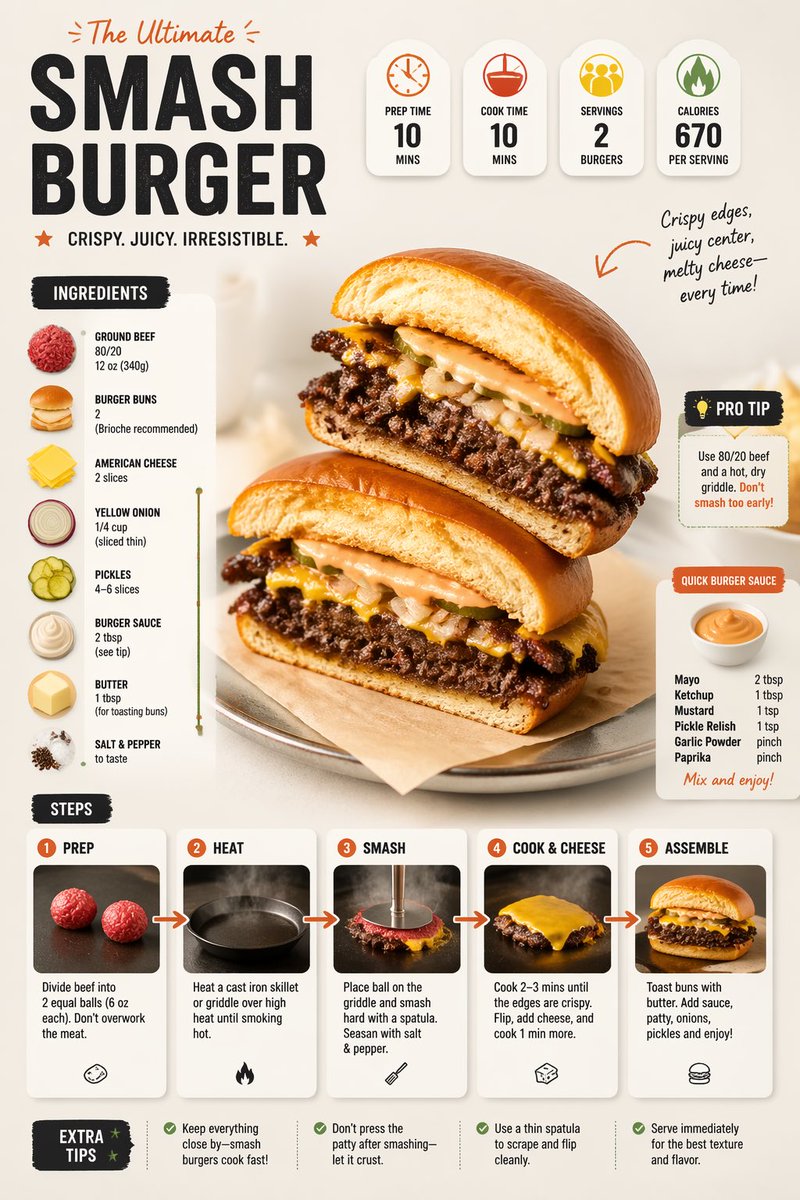 Prompt moderno de infografía de receta con diseño de comida
 Identidad de marca de hamburguesería a partir de una imagen de referencia
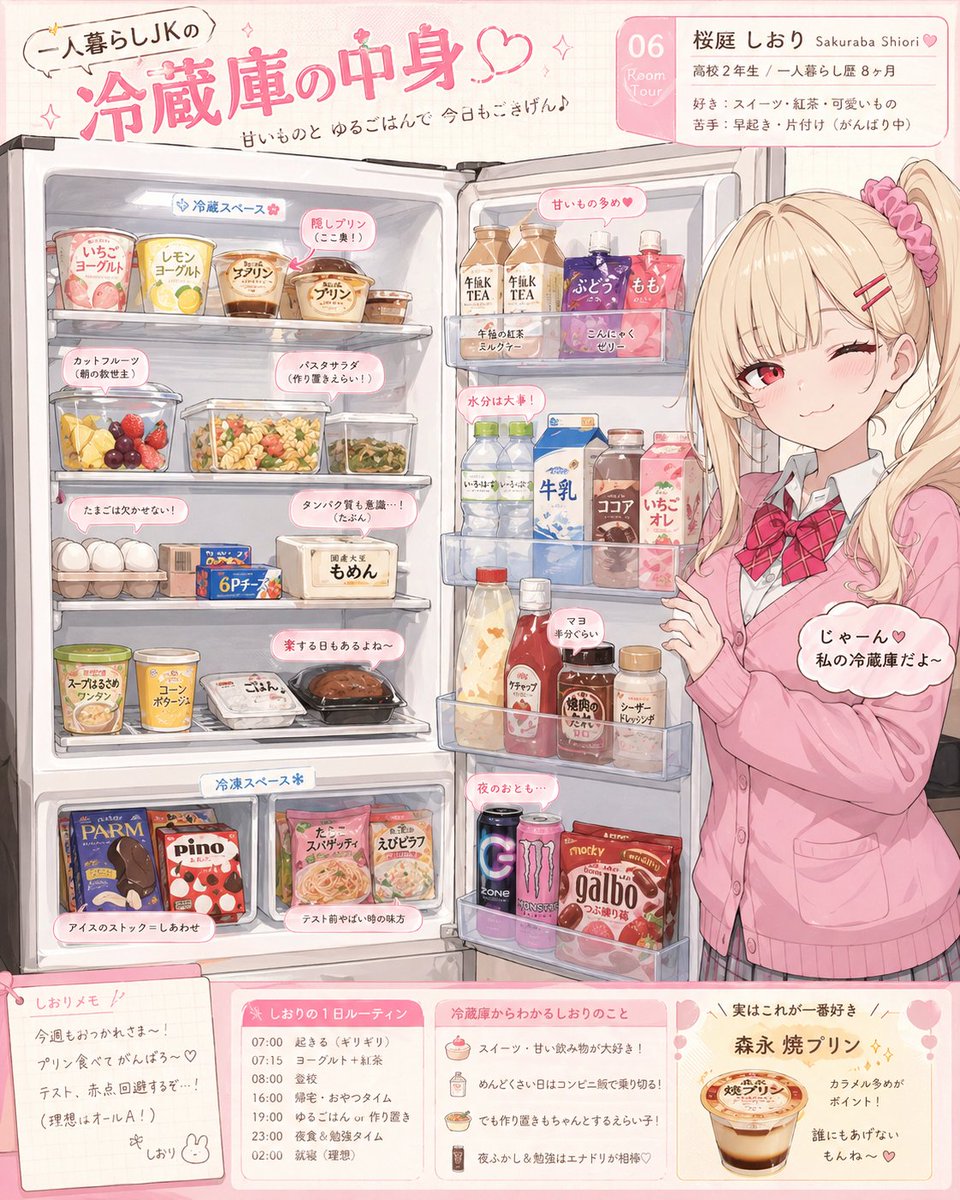 Ilustración del reveal de la nevera de un personaje de anime
 Diapositiva de poesía con lichi estilo cartel de museo
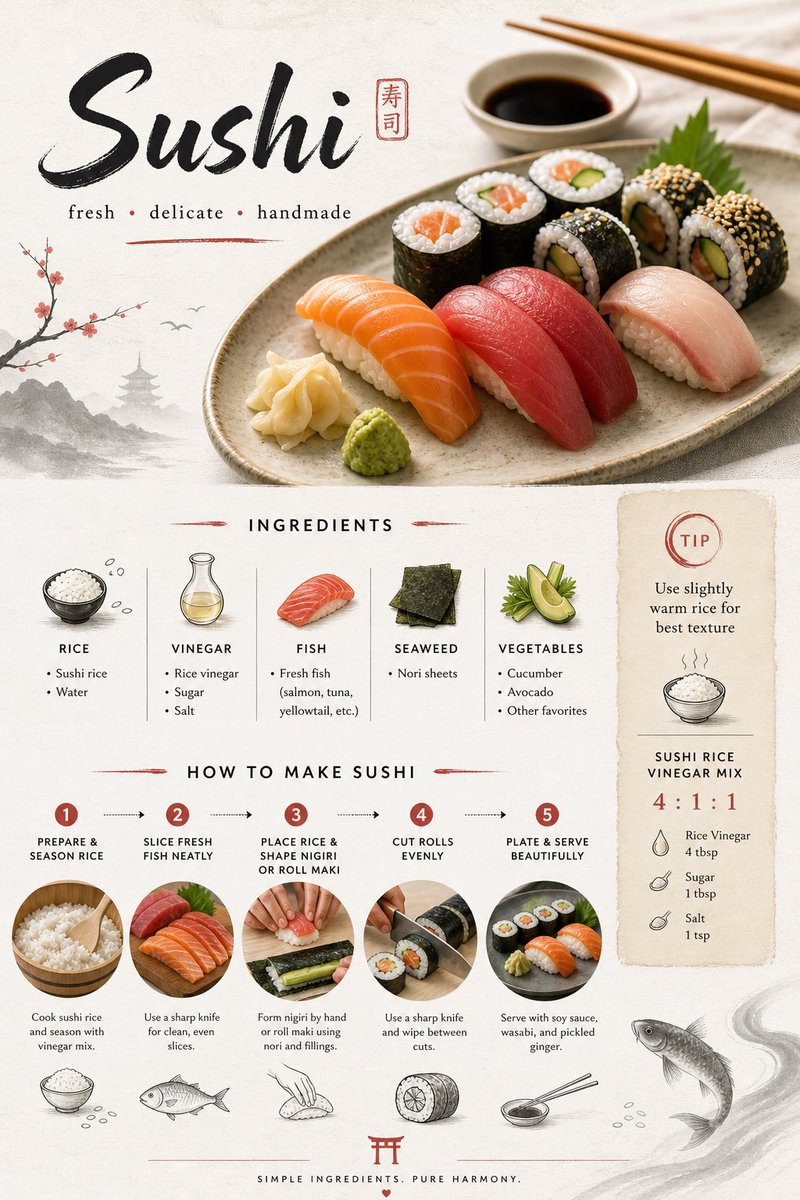 Diseño de tarjeta de receta de sushi japonés en estilo minimalista
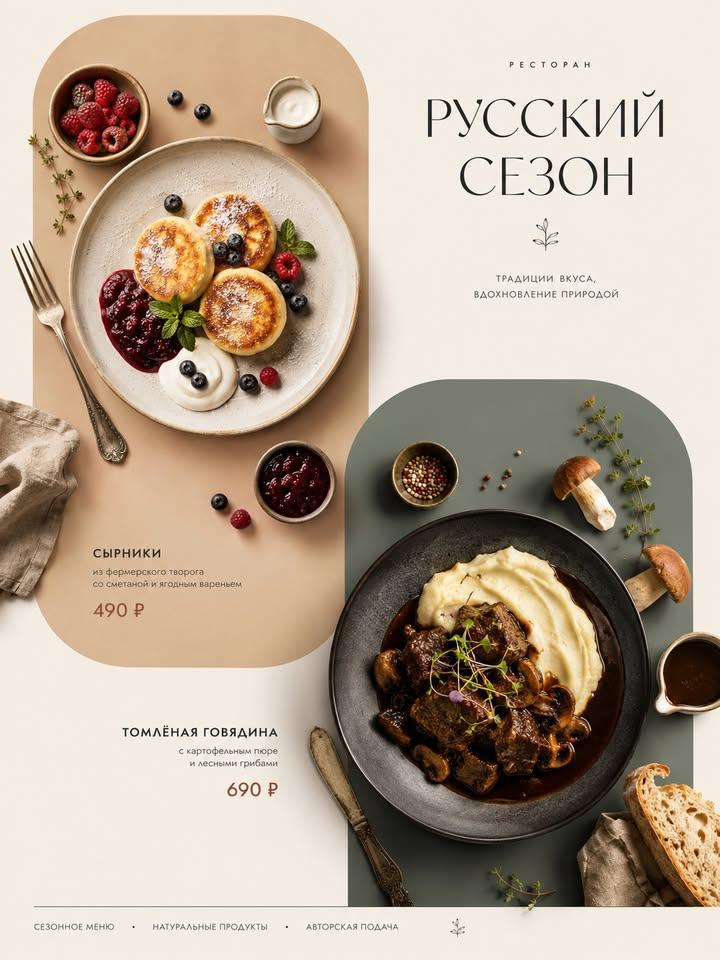 Cartel de menú con platos italianos desde arriba
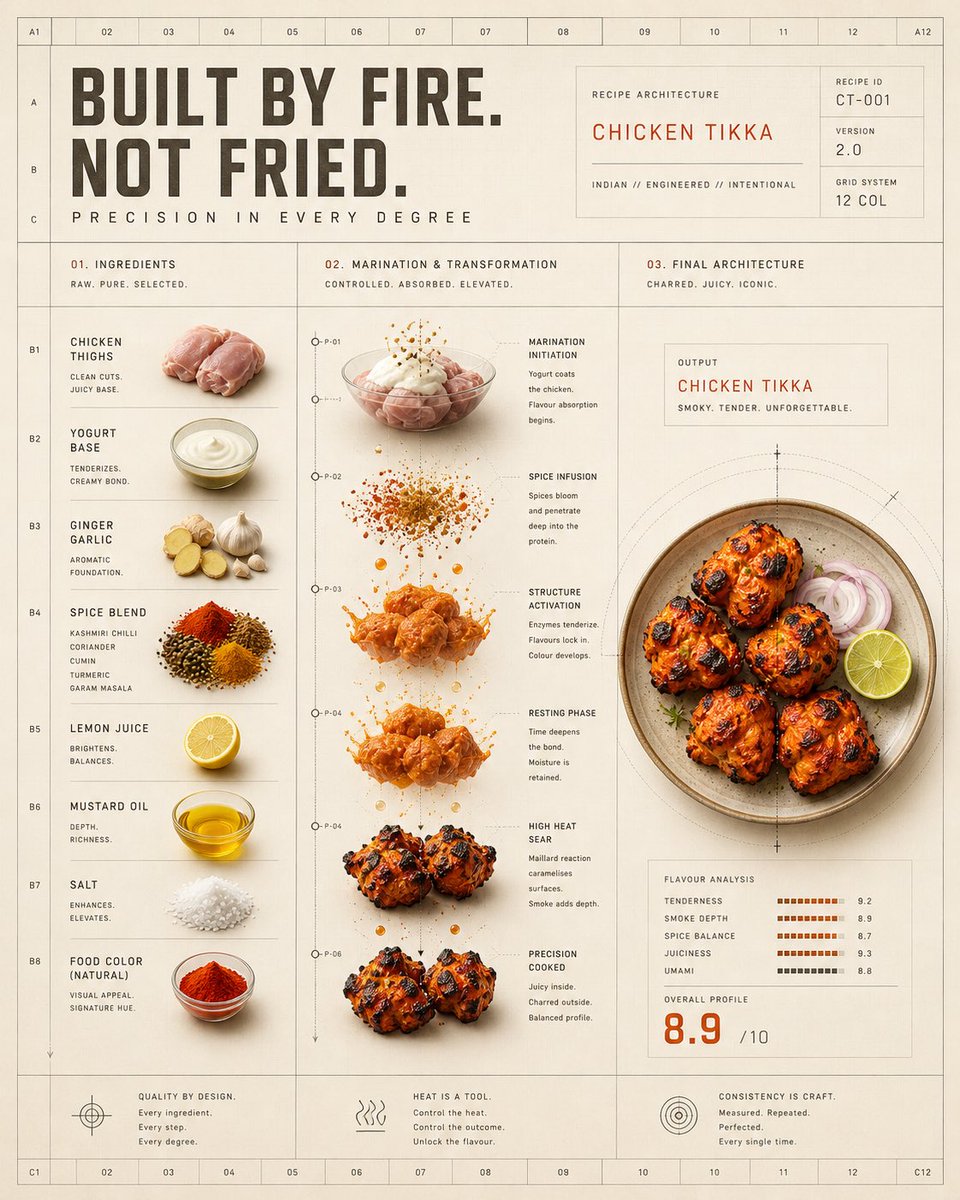 Póster de cuadrícula de transformación del calor del pollo tikka
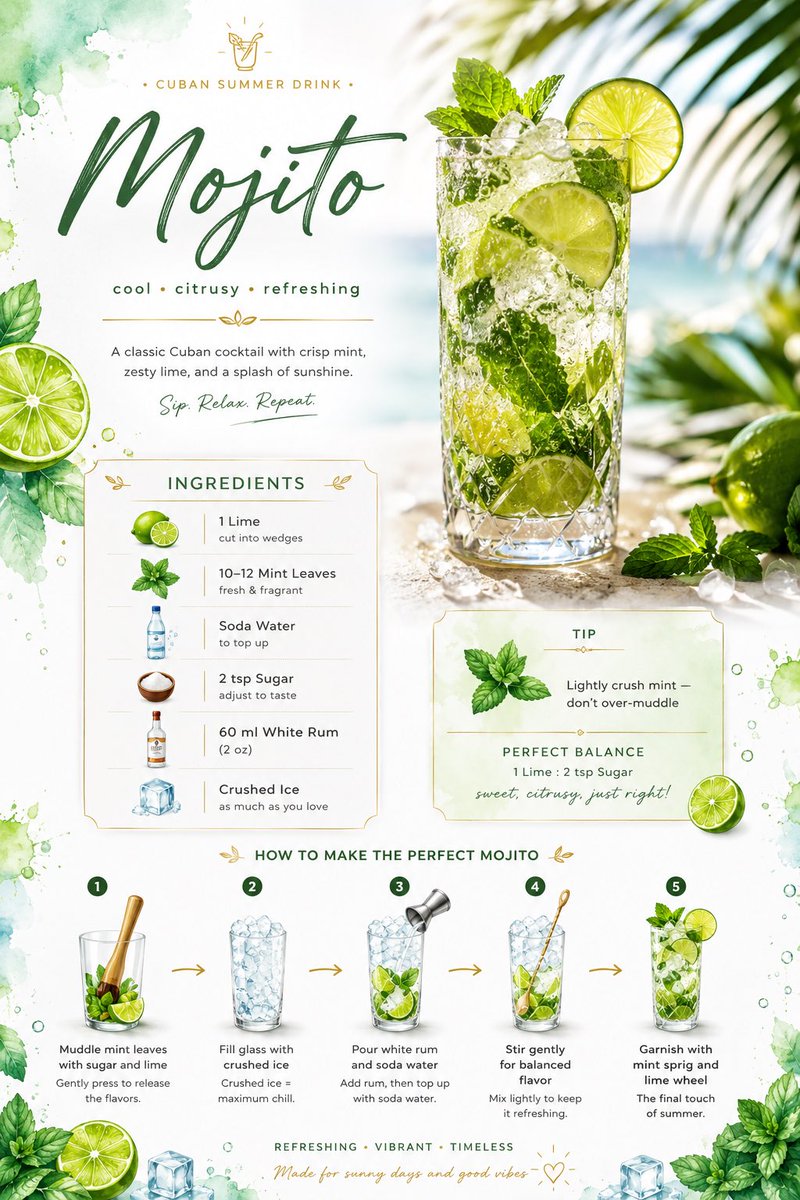 Tarjeta de receta de mojito con diseño de lima en acuarela