Bild-Prompt Essen & Trinken Anpassbar
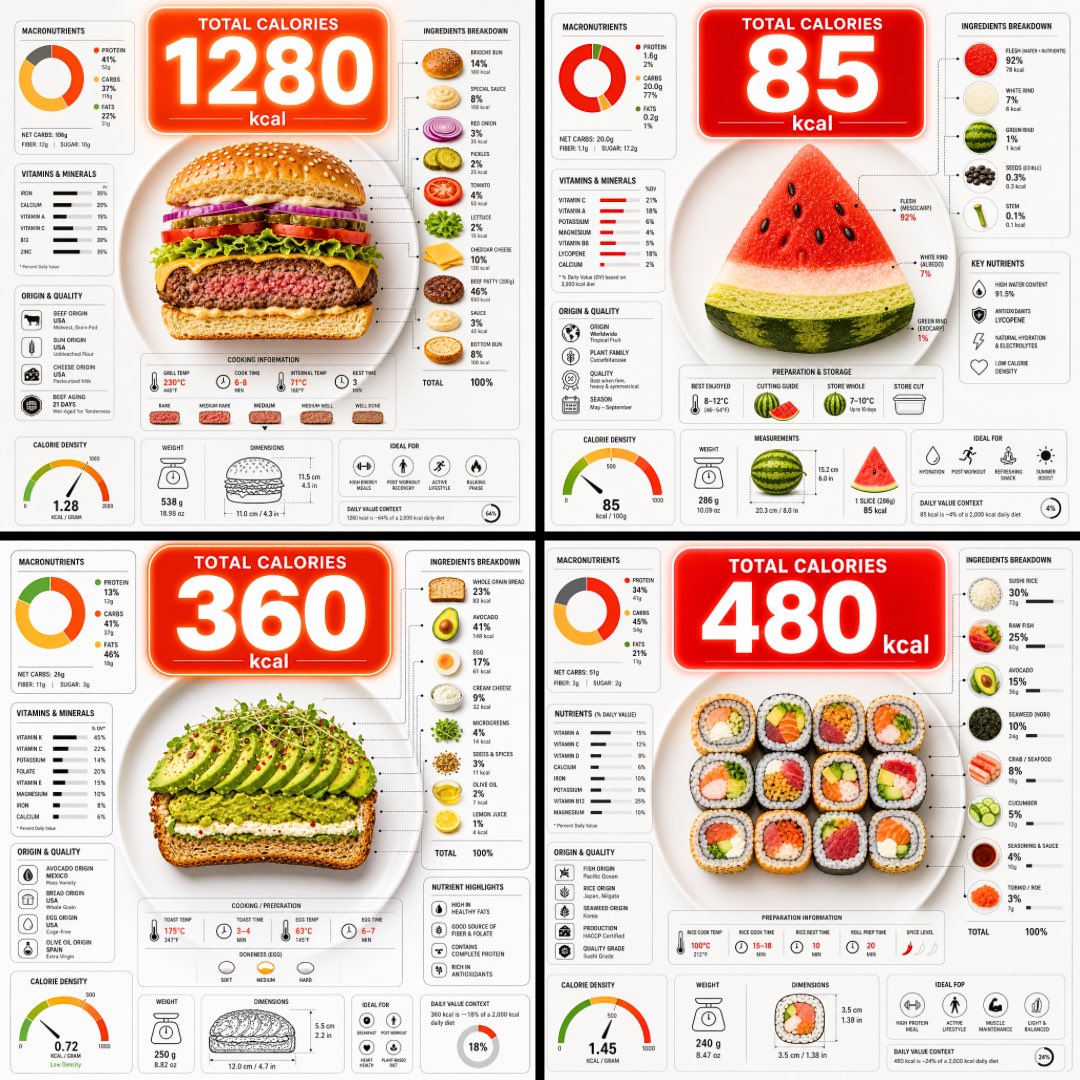
Kalorien-Infografik für Gerichte, Flat Lay von oben
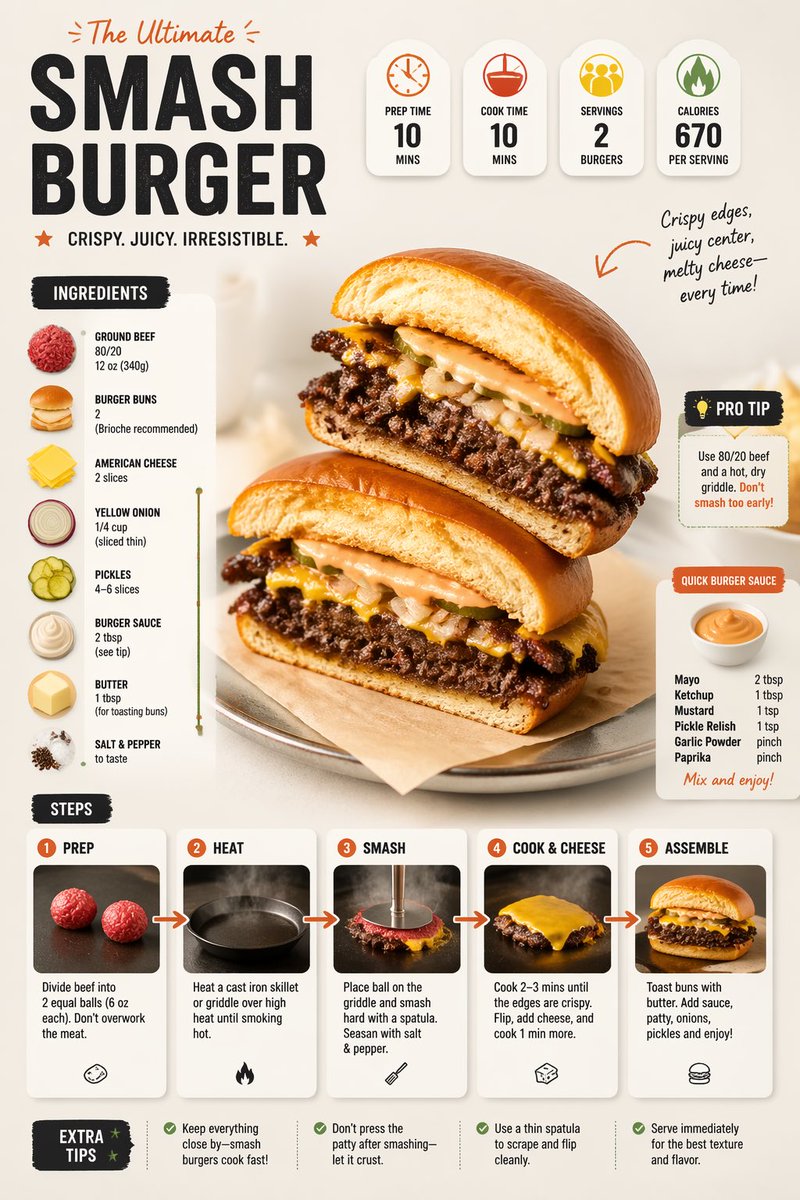
Eine Aufsicht auf einen aufgeschnittenen Teller, der seine Schichten zeigt, mit einer großen Kalorienblase, die darüber schwebt, und dichten Nährwertdiagrammen rundherum. Das Essen ist auf einen Blick klar erkennbar, und die Zahlen eignen sich als schneller Vergleich dessen, was auf dem Teller liegt.

- Modell
- GPT Image 2
- Typ
- Bild
- Seitenverhältnis
- 1:1
- Geteilt
- 9. Jun 2026
- Likes auf X
- 91
Essen
Bild-Prompt
2,034 ZeichenUltra-clean top-down (90° flat lay) infographic composition. A perfectly centered white ceramic plate sits on a seamless light background. On the plate: [FOOD], shown in a precise cross-section or layered cutaway, revealing internal ingredients, textures, and structure with extreme clarity. PRIMARY FOCAL POINT (HERO ELEMENT): Above the plate, occupying a large portion of the upper canvas, place an oversized floating infographic bubble displaying the scientifically accurate total calorie count for this exact food item and portion size. The calorie bubble is significantly larger than any other element, instantly readable at thumbnail size. Design it with strong visual contrast: bold sans-serif typography, thick outline or semi-transparent glassmorphism, subtle glow or drop shadow, and clean UI styling. This is the first thing the eye sees. SECONDARY ELEMENTS: Surrounding the plate, fill the remaining space with a dense, high-information infographic system using realistic, accurate nutritional data for this specific food: – Nutritional breakdown charts (protein, carbs, fats in exact grams) – Ingredient percentage bars and rings – Cooking or preparation temperatures and times – Origin, aging, or production icons – Measurement scales, micro-diagrams, data badges. All numbers must reflect real-world nutritional values for the depicted food. Use thin vector connectors, dotted lines, arrows, pictograms, and radial charts clearly linking data to specific food components. Visual hierarchy rules: Calorie bubble = dominant. Plate + food = secondary anchor. Surrounding data = tertiary but dense and readable. Design language: premium editorial infographic, Apple UI × National Geographic food science, extremely clean, structured, and modern. Color palette: natural food colors, monochrome infographic UI, one accent color reserved exclusively for the calorie bubble. Lighting: soft studio lighting, zero clutter, flat background for maximum contrast. Output: 1080×1080, ultra-crisp, social-feed optimized, no watermark.
So geht's
Ersetzen Sie den Platzhalter [FOOD] in eckigen Klammern durch das Gericht, das Sie zeigen möchten, und geben Sie die Portionsgröße an, damit die Kalorienblase passt. Behalten Sie den 90-Grad-Blickwinkel von oben, den weißen Teller auf hellem Hintergrund und die einzige Akzentfarbe für die Kalorienblase bei, denn diese Entscheidungen sorgen für ein klares Layout. Geteilt wurde er als GPT-Image-2-Prompt, und das Ergebnis funktioniert gut als quadratischer Post für ein Rezept oder einen Ernährungsbeitrag.
Am 9. Jun 2026 öffentlich auf X geteilt. Alle Rechte an diesem Prompt und seinem Ergebnis liegen beim Creator. Ist das Ihr Werk? Bitten Sie um Aktualisierung oder Entfernung.