Prompt εικόνας Φαγητό & Ποτό Προσαρμόσιμα
Infografικό θερμίδων σε πιάτο, κάτοψη
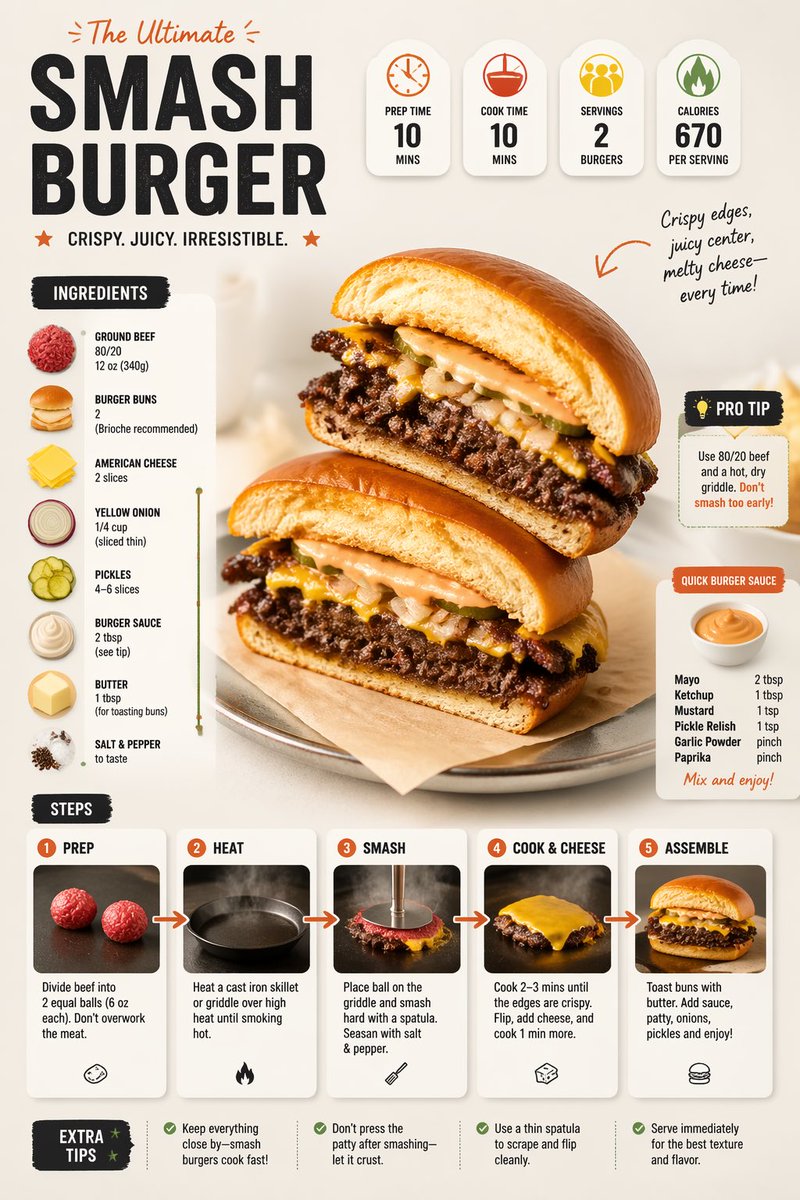
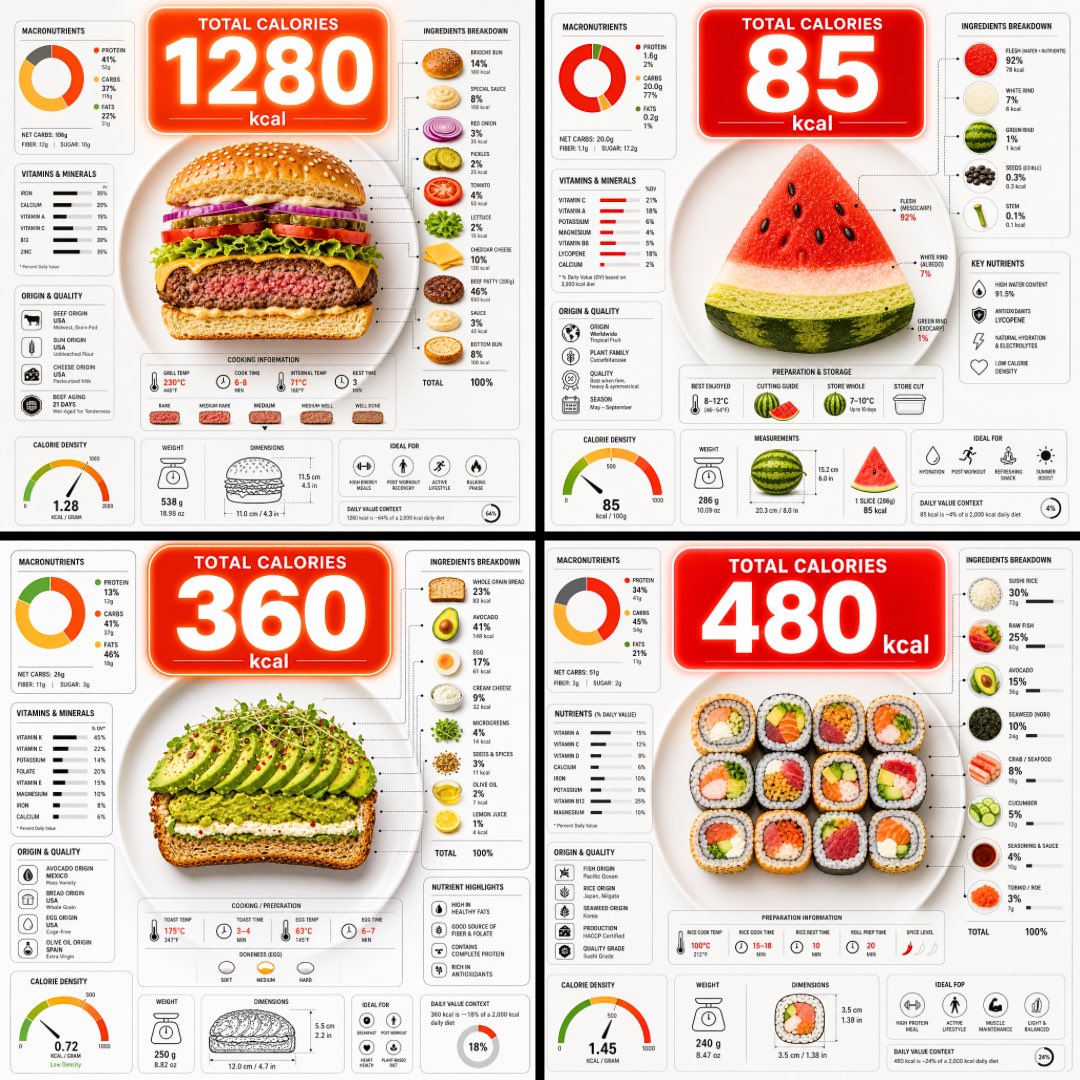
Κάτοψη ενός πιάτου κομμένου στη μέση, ώστε να φαίνονται τα στρώματά του, με μια μεγάλη φούσκα θερμίδων να αιωρείται πάνω του και πυκνά γραφήματα διατροφικής αξίας γύρω του. Το φαγητό διαβάζεται καθαρά με μια ματιά, και οι αριθμοί λειτουργούν ως γρήγορος τρόπος σύγκρισης όσων βρίσκονται στο πιάτο.

- Μοντέλο
- GPT Image 2
- Τύπος
- Εικόνα
- Αναλογία διαστάσεων
- 1:1
- Κοινοποιήθηκε
- 9 Ιουν 2026
- Likes στο X
- 91
Φαγητό
Prompt εικόνας
2,034 χαρακτήρεςUltra-clean top-down (90° flat lay) infographic composition. A perfectly centered white ceramic plate sits on a seamless light background. On the plate: [FOOD], shown in a precise cross-section or layered cutaway, revealing internal ingredients, textures, and structure with extreme clarity. PRIMARY FOCAL POINT (HERO ELEMENT): Above the plate, occupying a large portion of the upper canvas, place an oversized floating infographic bubble displaying the scientifically accurate total calorie count for this exact food item and portion size. The calorie bubble is significantly larger than any other element, instantly readable at thumbnail size. Design it with strong visual contrast: bold sans-serif typography, thick outline or semi-transparent glassmorphism, subtle glow or drop shadow, and clean UI styling. This is the first thing the eye sees. SECONDARY ELEMENTS: Surrounding the plate, fill the remaining space with a dense, high-information infographic system using realistic, accurate nutritional data for this specific food: – Nutritional breakdown charts (protein, carbs, fats in exact grams) – Ingredient percentage bars and rings – Cooking or preparation temperatures and times – Origin, aging, or production icons – Measurement scales, micro-diagrams, data badges. All numbers must reflect real-world nutritional values for the depicted food. Use thin vector connectors, dotted lines, arrows, pictograms, and radial charts clearly linking data to specific food components. Visual hierarchy rules: Calorie bubble = dominant. Plate + food = secondary anchor. Surrounding data = tertiary but dense and readable. Design language: premium editorial infographic, Apple UI × National Geographic food science, extremely clean, structured, and modern. Color palette: natural food colors, monochrome infographic UI, one accent color reserved exclusively for the calorie bubble. Lighting: soft studio lighting, zero clutter, flat background for maximum contrast. Output: 1080×1080, ultra-crisp, social-feed optimized, no watermark.
Πώς να το χρησιμοποιήσετε
Αντικαταστήστε το σύμβολο [FOOD] σε αγκύλες με το πιάτο που θέλετε να δείξετε και δηλώστε το μέγεθος μερίδας, ώστε η φούσκα θερμίδων να ταιριάζει. Κρατήστε τη γωνία κάτοψης των 90 μοιρών, το λευκό πιάτο σε ανοιχτό φόντο και το μοναδικό χρώμα έμφασης αποκλειστικά για τη φούσκα θερμίδων, καθώς αυτές οι επιλογές κάνουν τη διάταξη να διαβάζεται καθαρά. Κοινοποιήθηκε ως prompt για GPT Image 2 και το αποτέλεσμα λειτουργεί καλά ως τετράγωνη ανάρτηση για συνταγή ή εξήγηση διατροφής.
Κοινοποιήθηκε δημόσια στο X στις 9 Ιουν 2026. Όλα τα credits για αυτό το prompt και το αποτέλεσμά του ανήκουν στον δημιουργό του. Είναι δικό σας; Ζητήστε ενημέρωση ή αφαίρεση.